Sub-Region Snapshots
Harrisonburg & Rockingham County
Units Sold YTD
1,341
↑ +9.74%
12-Month Sales
1,341
↑ +9.74%
12-Month Avg Price
$386,274
↑ +9.38%
Months Supply
1.15
↓ -24.26%
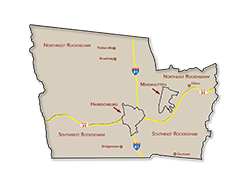
City of Harrisonburg
Units Sold YTD
282
↓ -3.09%
12-Month Avg Price
$331,901
↑ +6.94%
Months Supply
0.68
↓ -13.10%
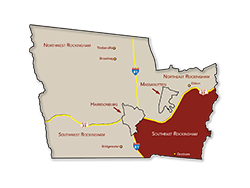
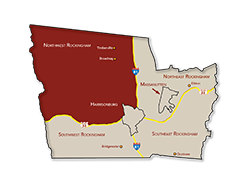
Southeast Rockingham
Units Sold YTD
480
↑ +29.73%
12-Month Avg Price
$412,716
↑ +6.46%
Months Supply
0.95
↓ -28.56%
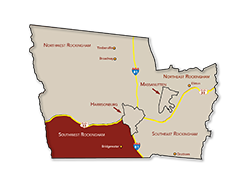
Southwest Rockingham
Units Sold YTD
190
↑ +2.15%
12-Month Avg Price
$381,029
↑ +5.58%
Months Supply
1.26
↓ -38.82%
Northwest Rockingham
Units Sold YTD
180
↑ +5.88%
12-Month Avg Price
$347,710
↑ +10.96%
Months Supply
1.67
↓ -26.22%
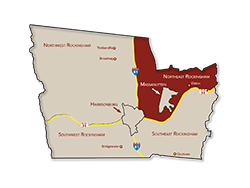
Northeast Rockingham
Units Sold YTD
126
↓ -5.97%
12-Month Avg Price
$371,625
↑ +8.10%
Months Supply
1.62
↓ -24.67%
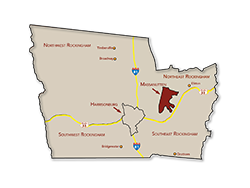
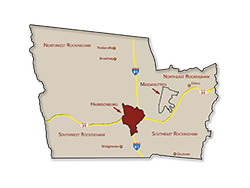
Massanutten
Units Sold YTD
83
↑ +16.90%
12-Month Avg Price
$535,969
↑ +12.24%
Months Supply
1.73
↑ +71.08%